Using Java Mission Control for performance monitoring
04.06.2014
This blog post intends to give some insight into what the monitoring and diagnostics tool Oracle Java Mission Control (JMC) is and how it can be used to investigate Java application performance. There is already a lot of very good writings available about this subject like this or this one. This post aims to be more practical presentation. In this post we’ll be connecting JMC to instance of SampleConsoleServer running on a remote host. Then we will log some runtime data with Java Flight Recorder and analyze it with Java Mission Control.
Note that Java Mission Control is free for use during development and testing but requires a license when used for production purposes.
What is Oracle Java Mission Control?
Oracle Java Mission Control is a tool suite for managing, monitoring, profiling, and troubleshooting your Java applications. Oracle Java Mission Control has been included in standard Java SDK since version 7u40. JMC consists of the JMX Console and the Java Flight Recorder. More plug-ins can easily be installed from within Mission Control. JMC can also be installed in Eclipse IDE.
Java Mission Control uses JMX to communicate with remote Java processes. The JMX Console is a tool for monitoring and managing a running JVM instance. The tool presents live data about memory and CPU usage, garbage collections, thread activity, and more. It also includes a fully featured JMX MBean browser that you can use to monitor and manage MBeans in the JVM and in your Java application.
To enable the remote management agent on a Java process we’ll add the following parameters when starting it:
-Dcom.sun.management.jmxremote=true
-Dcom.sun.management.jmxremote.port=3614
-Dcom.sun.management.jmxremote.authenticate=false
-Dcom.sun.management.jmxremote.ssl=false
Locally these options aren’t needed but in this example we’re going to run SampleConsoleServer on a remote testserver. Also note that screenshot below illustrates Eclipse’s “Run Configurations -> Arguments” tab.
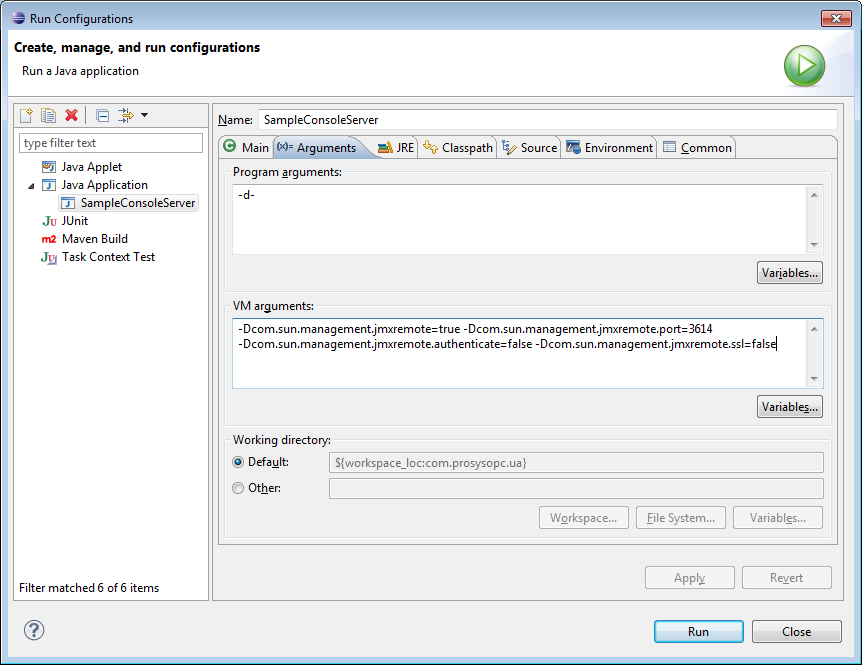
Now when the SampleConsoleServer is started it will allow JMX connections to port 3614. Port number was assigned randomly based on current date.
JMC is bundled together with JDK and can be found from “C:\Program Files\Java\jdk1.x.x_xx\bin\jmc.exe” on Windows machines.
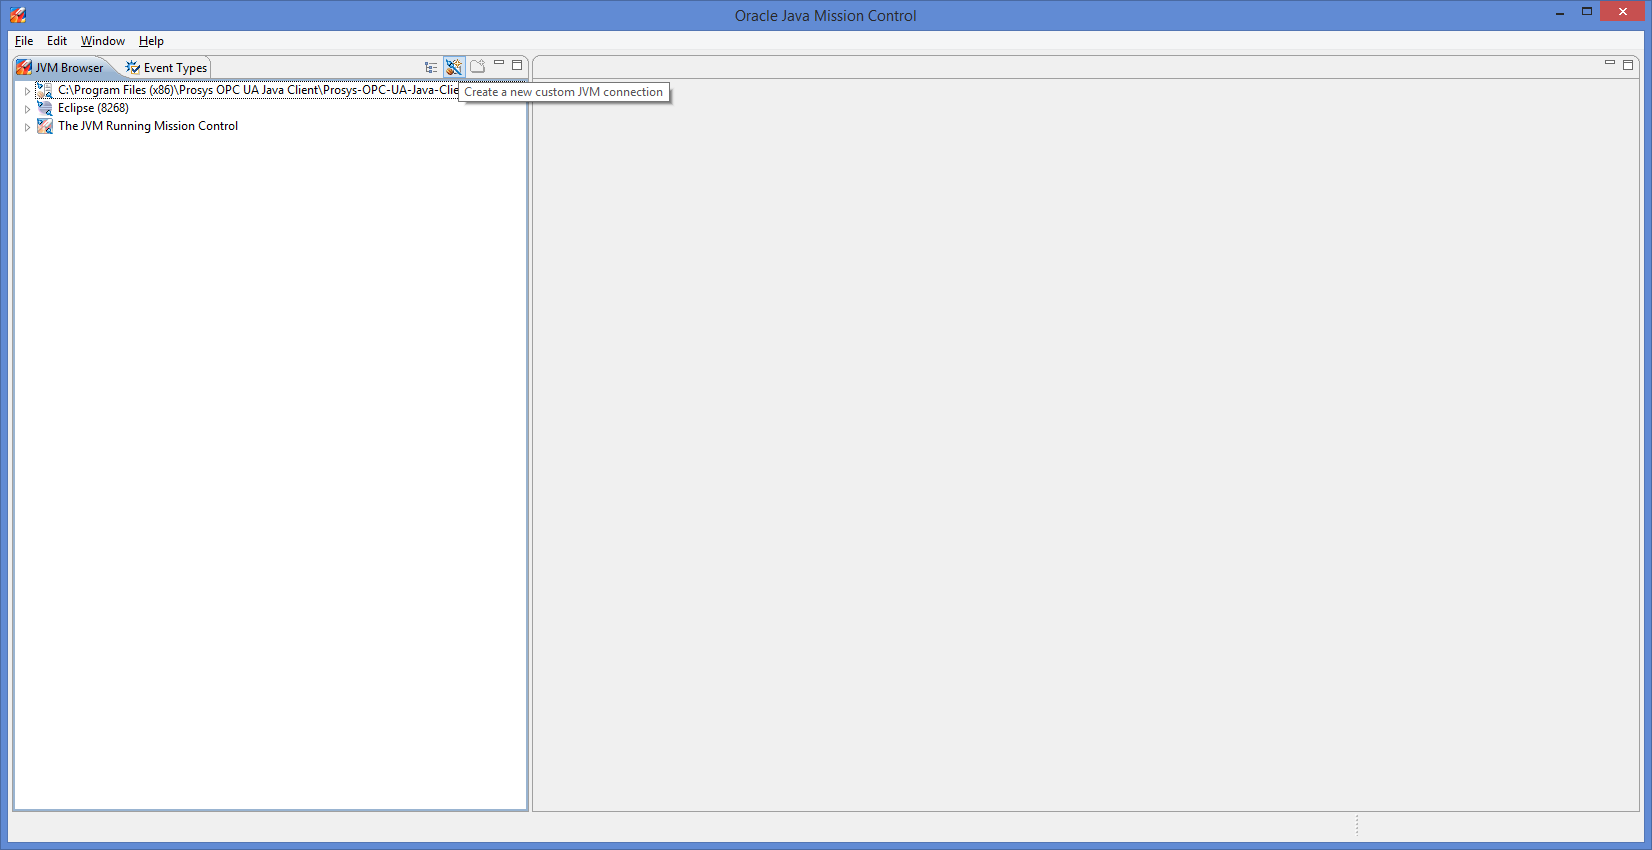
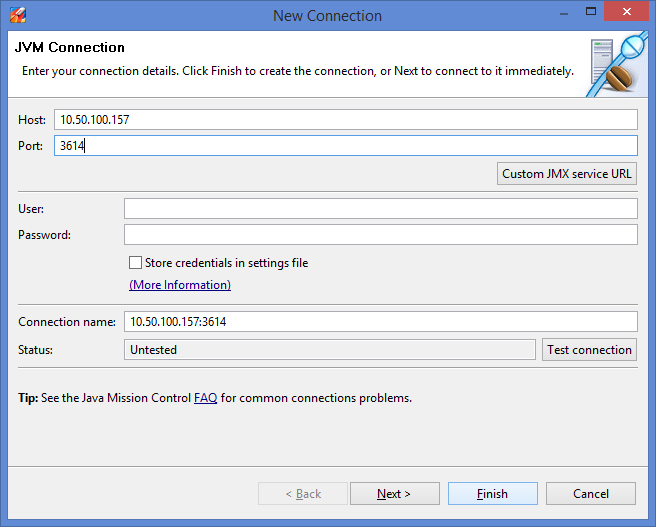
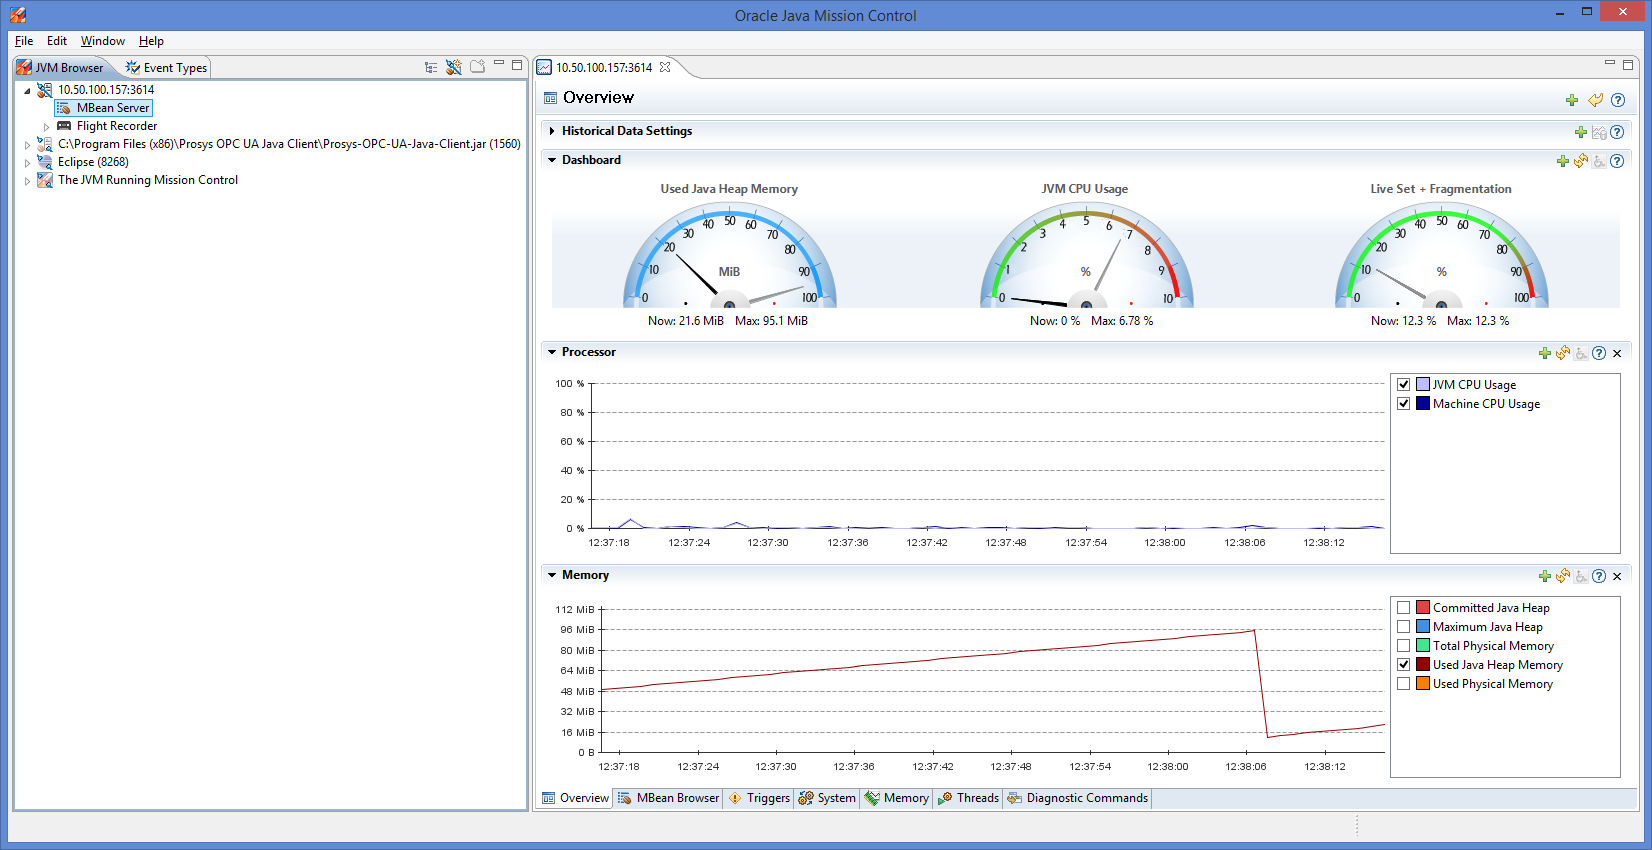
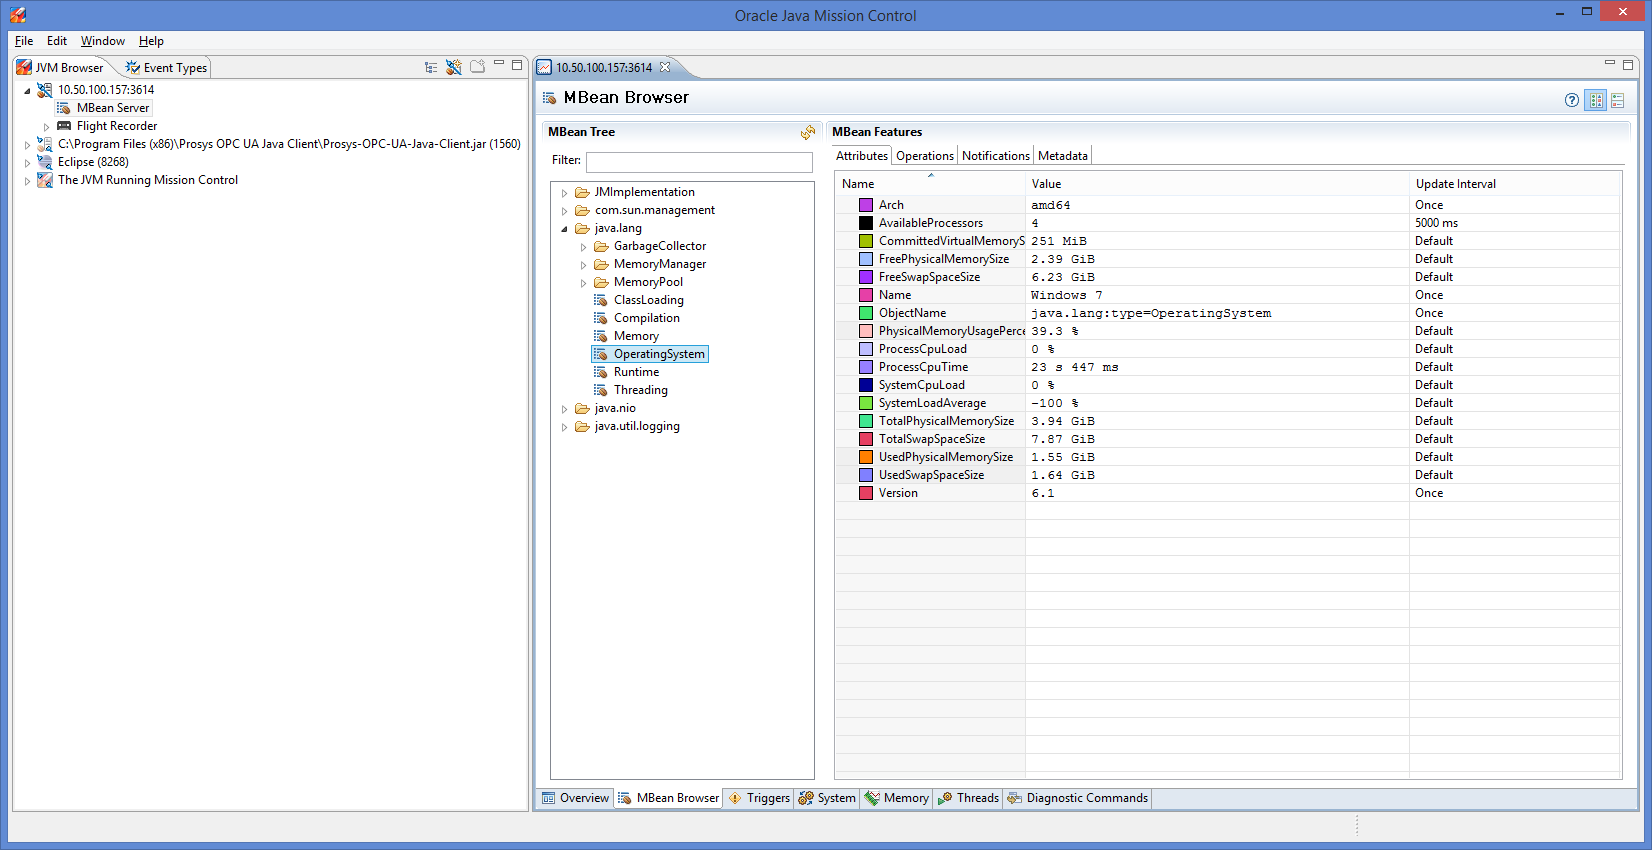
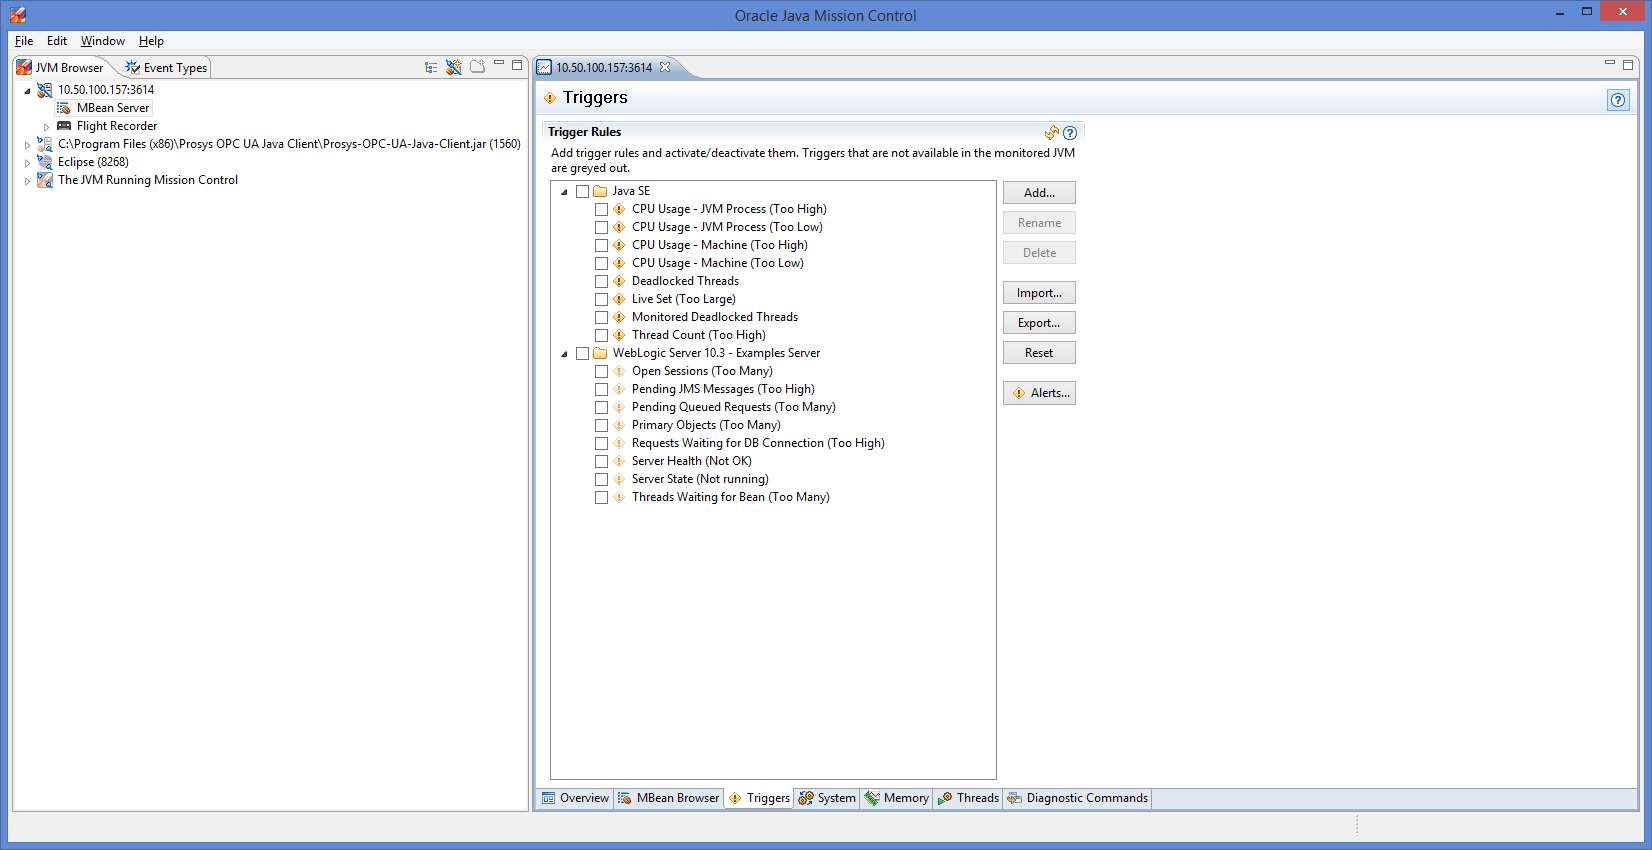
The tabbed pages provide runtime information about system properties, memory management, Java threads and more.
Java Flight Recorder
Java Flight Recorder is a profiling and event collection framework built into the Oracle JDK. Java Flight Recorder can be used to collect recordings without using JMC, but in this example we will be using these tools together.
The application which is to be analyzed must always be started with options
-XX:+UnlockCommercialFeatures -XX:+FlightRecorder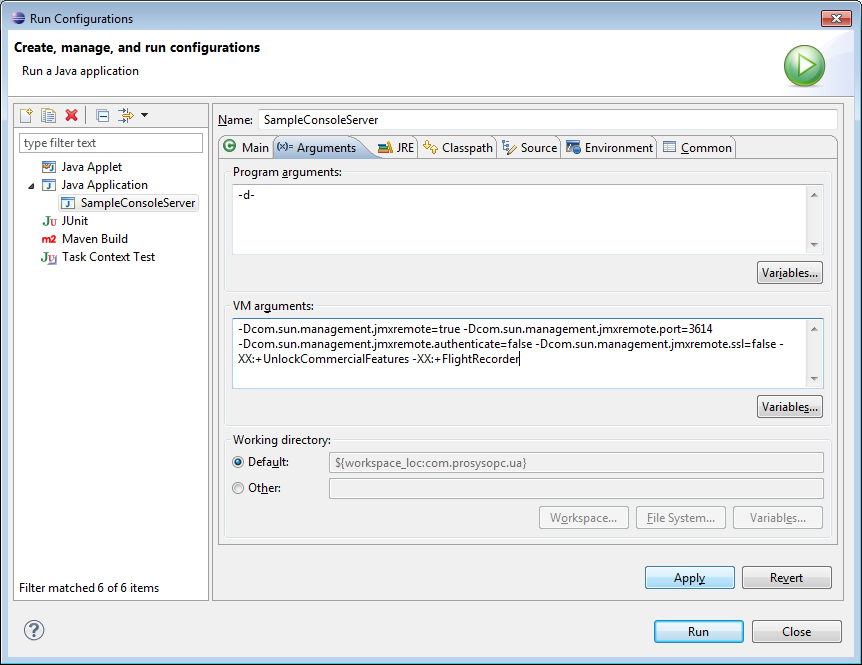
We’ll also run a script connecting UaClients, reading values from the SampleConsoleServer and disconnecting UaClients to get somewhat of a interesting dataset generated.
Flight Recording settings can be opened by double-clicking the “Flight Recorder” icon in the JMV Browser.
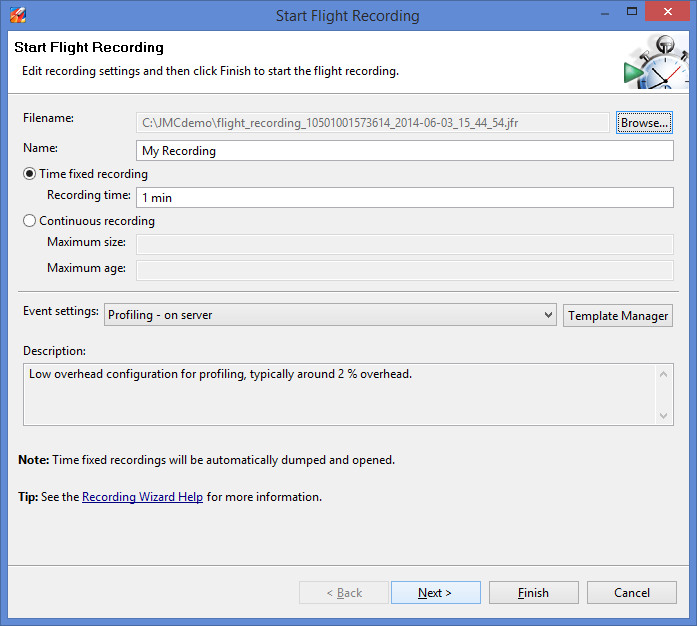
There are two alternative recording types: fixed recordings and continuous recordings. Continuous recordings have no end time defined and they must be explicitly dumped.
After clicking “Finish”, the lower edge of the screen will show the recording progress. In this example we will use fixed time recording and run the flight recording for 1 minute. After the recording finishes, the results can be analyzed with JMC.
The “General” tab of flight recording looks like this:
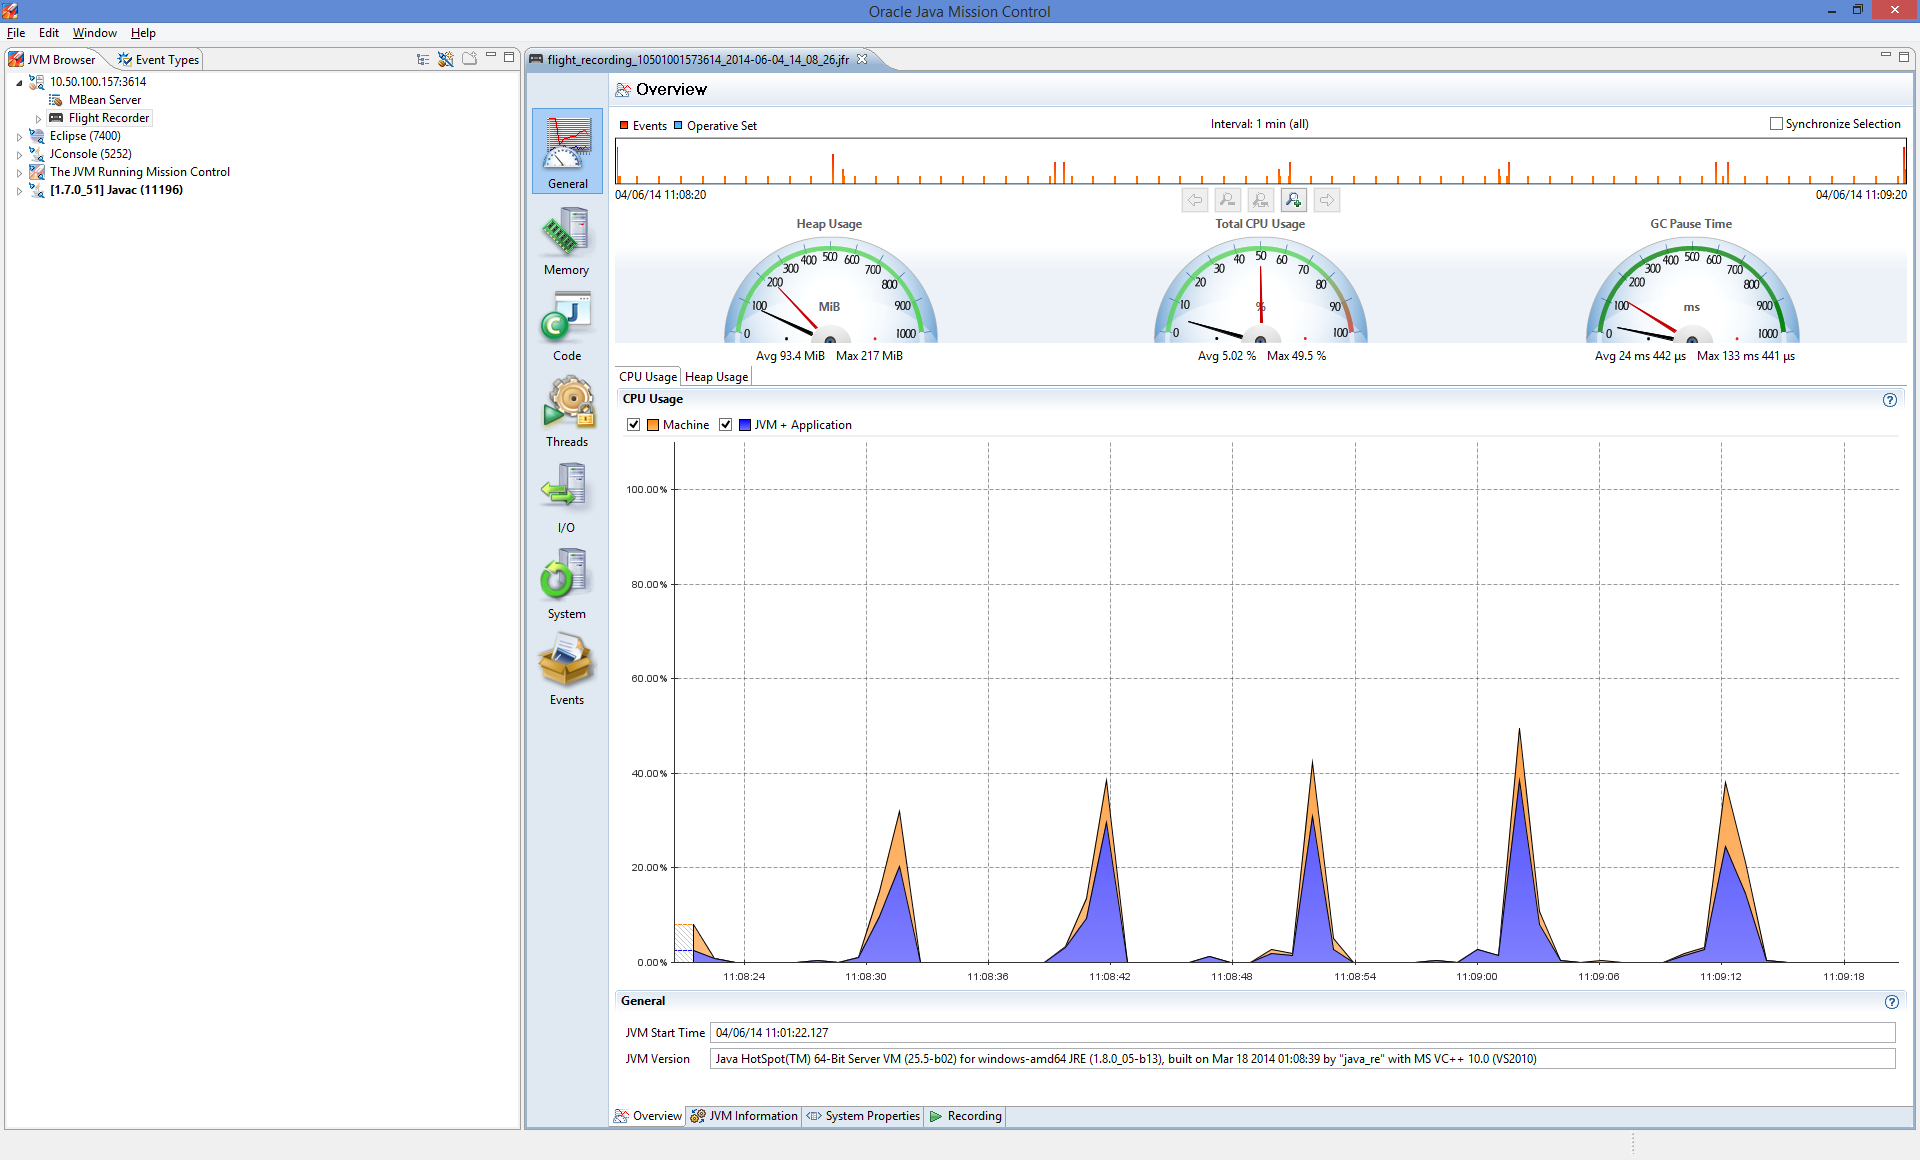
It is clearly visible from the CPU usage spikes that the script has connected and disconnected set of clients five times during the one minute time period of flight recording. Also in the beginning of recording last batch of previous clients were just about to disconnect from server.
Next we move on to the “Code” tab:
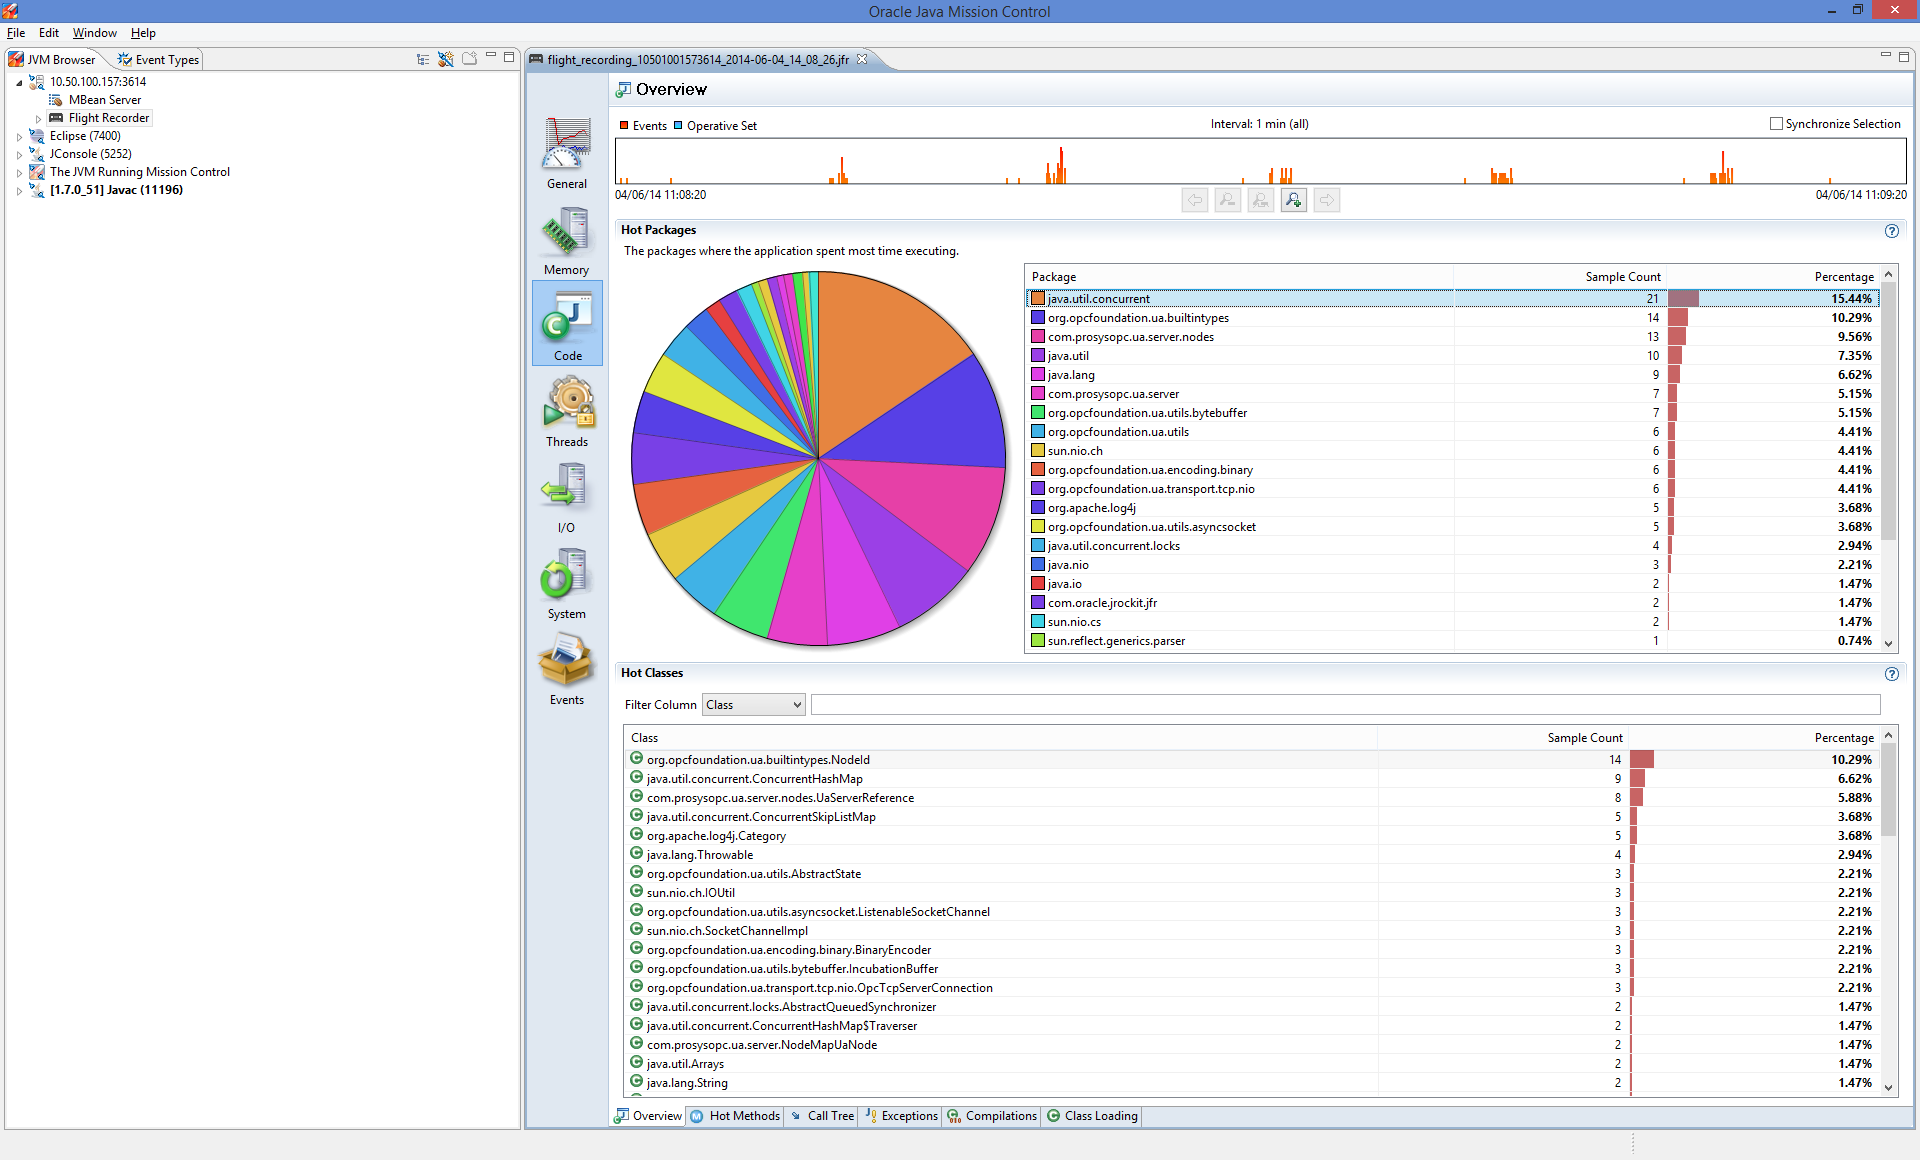
This tab shows us activity of different Packages and Classes. We can deduct that java.util.concurrent has been the most used Package during this execution and org.opcfoundation.us.builtintype.NodeId is the most used Class.
Let’s move on to the “Hot Methods” tab in the bottom of the screen:
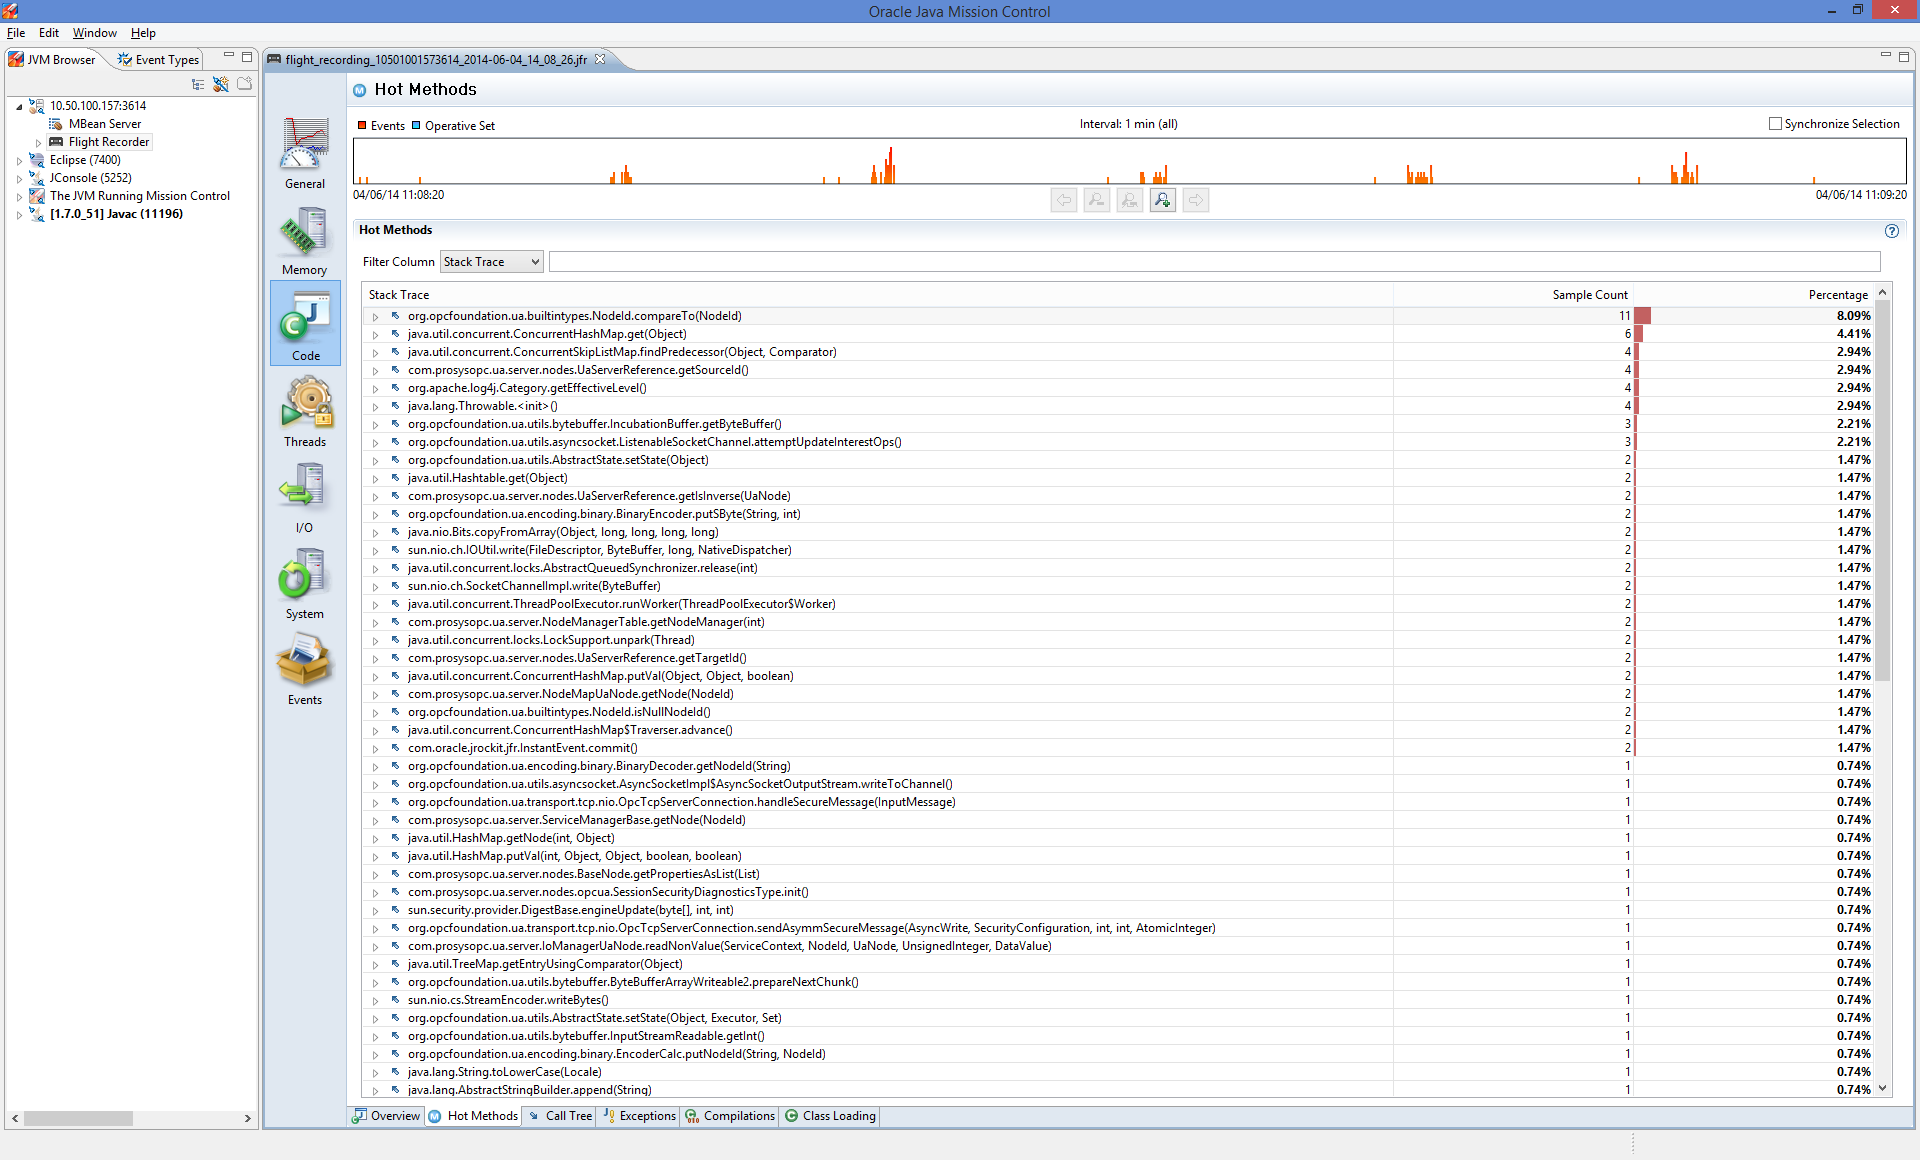
This view shows us the activity of specific methods and the origin from where these methods have been called. We can see that “org.opcfoundation.ua.builtintypes.NodeId.compareTo(NodeId)” consumed the most time in our execution setting.
Conclusion
This was a short introduction to using Java Mission Control and Flight Recorder. In a coming post we’ll be looking into declaring our own MBeans and MXBeans which can be viewed with a MBean browser. We’ll also make an example OPC UA server which publishes runtime data in it’s address space.
Similar tools to look into:
Java Mission Control is one of many performance monitoring and diagnostics tools available for the Java platform.

Heikki Tahvanainen
Customer Service Manager
Email: heikki.tahvanainen@prosysopc.com
Expertise and responsibility areas: Prosys OPC product and service sales and customer relationships
Tags: Java, Performance, Oracle
comments powered by DisqusAbout Prosys OPC Ltd
Prosys OPC is a leading provider of professional OPC software and services with over 20 years of experience in the field. OPC and OPC UA (Unified Architecture) are communications standards used especially by industrial and high-tech companies.
Newest blog posts
Why Do Standards Matter in Smart Manufacturing?
The blog post discusses the importance of standards in smart manufacturing, envisioning a future where auto-configurable systems in manufacturing rely on standardized data formats for seamless integration and reduced costs, with a focus on the OPC UA standard family as a key enabler.
OPC UA PubSub to Cloud via MQTT
Detailed overview of the demo presented at the OPC Foundation booth
SimServer How To #3: Simulate data changes on a server using an OPC UA client
A two-part step-by-step tutorial on how to write data changes on an OPC UA server using an OPC UA client.
